Activity Tracking
When I signed up for my first Rick Steves tour, I had lots of questions. One of them was just how active is this tour going to be? The answer, I found out, was that it's pretty much as active as you want to make it. Even days labeled as lots of activity, usually only top out at around 10,000 steps of group walking.
So I thought I'd track my activity level on this trip so you can get an idea of what it would take to participate in each activity. I tracked all my steps and flights of stairs with my Fitbit One. The Fitbit is a pedometer with an accelerometer built in which allows for very accurate tracking of every move I make. First, a few confessions about my activity level: I usually average about 15,000 a day and if I'm close to a Fitbit goal level like 15,000 or 20,000 I will mindless walk around until I hit that goal. My highest all-time step day came touring Beijing: 40,007 steps or about 18 miles so I'm more than willing to walk a lot when I travel. Finally, I've never met a set of stairs I didn't like.
So I thought I'd track my activity level on this trip so you can get an idea of what it would take to participate in each activity. I tracked all my steps and flights of stairs with my Fitbit One. The Fitbit is a pedometer with an accelerometer built in which allows for very accurate tracking of every move I make. First, a few confessions about my activity level: I usually average about 15,000 a day and if I'm close to a Fitbit goal level like 15,000 or 20,000 I will mindless walk around until I hit that goal. My highest all-time step day came touring Beijing: 40,007 steps or about 18 miles so I'm more than willing to walk a lot when I travel. Finally, I've never met a set of stairs I didn't like.
Reading the Data
I've included my activity and step graphs for each day. I didn't reset my Fitbit clock to European hours so you'll see that I tend to start taking steps around midnight which is 7am local time.
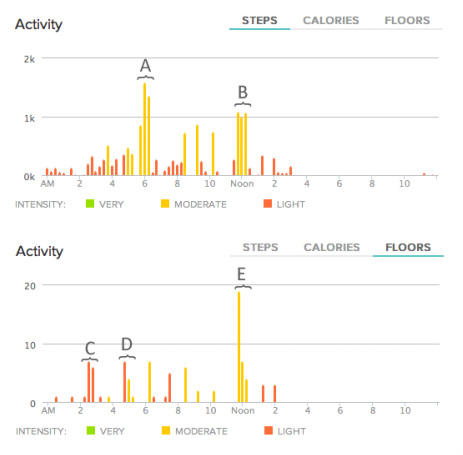
Each of the bars on the graph represents a 15 minute time increment. Fitbit color codes the intensity in each of those time increments: Red for light activity, yellow for moderate activity and green for high activity.
I've added in callouts to each of the graphs so you can correlate my activities with steps and flights of stairs. In the example day on the left, we toured Lake Bled and bused to the Soča river valley.
Totals for the day: 16,310 steps, 90 flights of stairs
Each of the bars on the graph represents a 15 minute time increment. Fitbit color codes the intensity in each of those time increments: Red for light activity, yellow for moderate activity and green for high activity.
I've added in callouts to each of the graphs so you can correlate my activities with steps and flights of stairs. In the example day on the left, we toured Lake Bled and bused to the Soča river valley.
- A: Walking around Lake Bled (until we ran into friends and had to stop walking so we could go eat kremšnita)
- B: Walking up to the Italian mausoleum, Kostnica
- C: Taking the steep path up into the castle overlooking Lake Bled and stairs inside the castle
- D: Climbing up the 99 steps on the island in Lake Bled and climbing the bell tower
- E: Climbing up to Kostnica, ~30 flights of stairs
Totals for the day: 16,310 steps, 90 flights of stairs
